Nomogram (nonfiction)

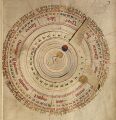
A nomogram (from Greek νόμος nomos, "law" and γραμμή grammē, "line"), also called a nomograph, alignment chart or abaque, is a graphical calculating device, a two-dimensional diagram designed to allow the approximate graphical computation of a mathematical function.
The field of nomography was invented in 1884 by the French engineer Philbert Maurice d’Ocagne (1862-1938) and used extensively for many years to provide engineers with fast graphical calculations of complicated formulas to a practical precision.
Nomograms use a parallel coordinate system invented by d'Ocagne rather than standard Cartesian coordinates.
A nomogram consists of a set of n scales, one for each variable in an equation.
Knowing the values of n-1 variables, the value of the unknown variable can be found, or by fixing the values of some variables, the relationship between the unfixed ones can be studied.
The result is obtained by laying a straightedge across the known values on the scales and reading the unknown value from where it crosses the scale for that variable.
The virtual or drawn line created by the straightedge is called an index line or isopleth.
Other types of graphical calculators such as intercept charts, trilinear diagrams and hexagonal charts are sometimes called nomograms.
In the News
Volvelle retrains for career as nomogram.
Steganographic analysis of the Ishango bone unexpectedly reveals new class of nomograms.
Fiction cross-reference
- Nomogram - a two-dimensional computational diagram designed to exert force approximately equal to the graphical computation of a mathematical function.
Nonfiction cross-reference
- Cartogram (nonfiction) - a map in which some thematic mapping variable – such as travel time, population, or GNP – is substituted for land area or distance. The geometry or space of the map is distorted, sometimes extremely, in order to convey the information of this alternate variable. They are primarily used to display emphasis and for analysis as nomograms.
- Computation (nonfiction)
- Philbert Maurice d’Ocagne (nonfiction)
- Function (nonfiction)
- Slide rule (nonfiction)
- Volvelle (nonfiction)
External links:
- Nomogram @ Wikipedia
- Online pressure-temperature nomogram. @ sigmaaldrich.com