Time series (nonfiction): Difference between revisions
No edit summary |
|||
| Line 7: | Line 7: | ||
== In the News == | == In the News == | ||
<gallery | <gallery> | ||
File:Gladiator movie poster.jpg|link=What we do in life echoes in eternity (nonfiction)|[[What we do in life echoes in eternity (nonfiction)|What we do in life echoes in eternity]], according to new time series analysis. | File:Gladiator movie poster.jpg|link=What we do in life echoes in eternity (nonfiction)|[[What we do in life echoes in eternity (nonfiction)|What we do in life echoes in eternity]], according to new time series analysis. | ||
</gallery> | </gallery> | ||
Latest revision as of 10:15, 24 June 2017
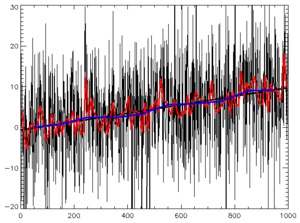
A time series is a series of data points listed (or graphed) in time order.
Most commonly, a time series is a sequence taken at successive equally spaced points in time. Thus it is a sequence of discrete-time data. Examples of time series are heights of ocean tides, counts of sunspots, and the daily closing value of the Dow Jones Industrial Average.
Time series are used in statistics, signal processing, pattern recognition, econometrics, mathematical finance, weather forecasting, intelligent transport and trajectory forecasting, earthquake prediction, electroencephalography, control engineering, astronomy, communications engineering, and largely in any domain of applied science and engineering which involves temporal measurements.
In the News
What we do in life echoes in eternity, according to new time series analysis.
Fiction cross-reference
Nonfiction cross-reference
External links:
- Time series @ Wikipedia

