File:Complex function plot.jpg: Difference between revisions
Jump to navigation
Jump to search
No edit summary |
No edit summary |
||
| Line 8: | Line 8: | ||
<gallery> | <gallery> | ||
File:Exponential-growth-diagram.svg|link=Crimes against mathematical constants|[[Crimes against mathematical constants]] threaten to undo years of [[Complex analysis (nonfiction)|complex analysis]] research. | |||
</gallery> | </gallery> | ||
Latest revision as of 08:34, 19 August 2018
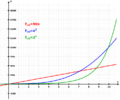
Nonfiction: Color wheel graph of the function f(z) = (z2 − 1)(z + 2 − i)2 / (z2 + 2 - 2i). Hue represents the argument, brightness the magnitude.
See Complex analysis (nonfiction).
In the News
Crimes against mathematical constants threaten to undo years of complex analysis research.
Fiction cross-reference
Nonfiction cross-reference
- Complex number (nonfiction)
- Function (mathematics) (nonfiction)
- Mathematics (nonfiction)
- Several complex variables (nonfiction) - a branch of mathematics dealing with complex valued functions on the space Cn of n-tuples of complex numbers.
External links:
- Complex analysis @ Wikipedia
Attribution: By Claudio Rocchini - Own work, CC BY 2.5, https://commons.wikimedia.org/w/index.php?curid=2528616
File history
Click on a date/time to view the file as it appeared at that time.
| Date/Time | Thumbnail | Dimensions | User | Comment | |
|---|---|---|---|---|---|
| current | 08:20, 19 August 2018 |  | 480 × 480 (39 KB) | Admin (talk | contribs) |
You cannot overwrite this file.
File usage
The following 3 pages use this file:
