Venn diagram (nonfiction): Difference between revisions
Jump to navigation
Jump to search
| Line 11: | Line 11: | ||
<gallery mode="traditional"> | <gallery mode="traditional"> | ||
File:John Venn computing diagram.jpg|link=John Venn (nonfiction)|[[John Venn (nonfiction)|John Venn]] gathers his thoughts, groups them into [[Set theory (nonfiction)|logical categories]]. | File:John Venn computing diagram.jpg|link=John Venn (nonfiction)|[[John Venn (nonfiction)|John Venn]] gathers his thoughts, groups them into [[Set theory (nonfiction)|logical categories]]. | ||
File:Bread_mold_flavor,_best_flavor,_crazy_talk.png|Venn diagram shows intersection of "Bread mold flavor", "Best flavor", and "Crazy talk". | File:Bread_mold_flavor,_best_flavor,_crazy_talk.png|link=Bread mold flavor (nonfiction)|Venn diagram shows [[Bread mold flavor (nonfiction)|intersection of "Bread mold flavor", "Best flavor", and "Crazy talk"]]. | ||
</gallery> | </gallery> | ||
Revision as of 15:59, 8 August 2016

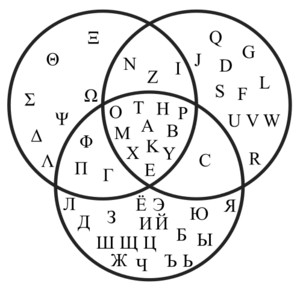
Venn diagram showing which uppercase letter glyphs are shared by the Greek, Latin and Russian alphabets.
A Venn diagram (also known as a set diagram or logic diagram) is a diagram that shows all possible logical relations between a finite collection of different sets.
Venn diagrams are a special case of Euler diagrams, which do not necessarily show all relations.
Venn diagrams were conceived around 1880 by John Venn.
They are used to teach elementary set theory, as well as illustrate simple set relationships in probability, logic, statistics, linguistics and computer science.
In the News
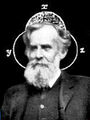
John Venn gathers his thoughts, groups them into logical categories.
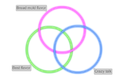
Venn diagram shows intersection of "Bread mold flavor", "Best flavor", and "Crazy talk".
Fiction cross-reference
Nonfiction cross-reference
External links:
- Venn diagram @ Wikipedia
- Online Venn diagram generator @ readwritethink.org
- Online Venn diagram generator @ creately.com/
- Online Venn diagram generator @ bioinformatics.lu
- Online Venn diagram generator @ classtools.net
- Online Venn diagram generator @ meta-chart.com