Voronoi diagram (nonfiction): Difference between revisions
Jump to navigation
Jump to search
No edit summary |
No edit summary |
||
| Line 38: | Line 38: | ||
* [http://www.raymondhill.net/voronoi/rhill-voronoi.html Javascript implementation of Steven J. Fortune's algorithm to compute Voronoi diagrams] | * [http://www.raymondhill.net/voronoi/rhill-voronoi.html Javascript implementation of Steven J. Fortune's algorithm to compute Voronoi diagrams] | ||
* [https://www.jasondavies.com/lloyd/ Lloyd’s Relaxation] - generates a centroidal Voronoi tessellation, which is where the seed point for each Voronoi region is also its centroid | * [https://www.jasondavies.com/lloyd/ Lloyd’s Relaxation] - generates a centroidal Voronoi tessellation, which is where the seed point for each Voronoi region is also its centroid | ||
* [http://blog.ivank.net/voronoi-diagram-in-javascript.html Voronoi diagram in JavaScript] | |||
* [https://www.jasondavies.com/maps/voronoi/ Spherical Voronoi Diagram] | |||
* [https://rosettacode.org/wiki/Voronoi_diagram Voronoi diagram code examples] @ rosettacode.org | * [https://rosettacode.org/wiki/Voronoi_diagram Voronoi diagram code examples] @ rosettacode.org | ||
Revision as of 12:11, 30 September 2018
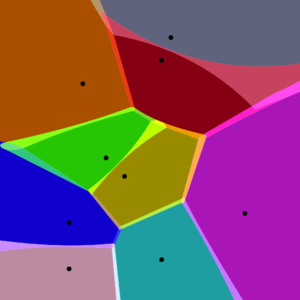
In mathematics, a Voronoi diagram is a partitioning of a plane into regions based on distance to points in a specific subset of the plane.
It is named after Georgy Voronoi, and is also called a Voronoi tessellation, a Voronoi decomposition, a Voronoi partition, or a Dirichlet tessellation (after Peter Gustav Lejeune Dirichlet).
Voronoi diagrams have practical and theoretical applications to a large number of fields, mainly in science and technology but also including visual art.
In the News
Fantasy Voronoi diagram color commentators discussing recent scores from hotly contested Voronoi diagrams.
Fiction cross-reference
Nonfiction cross-reference
- Centroidal Voronoi tessellation (nonfiction)
- Lloyd's algorithm (nonfiction)
- Mathematics (nonfiction)
- Mathematical diagram (nonfiction)
External links:
- Voronoi diagram @ Wikipedia
- Jump Flood Voronoi for WebGL
- Voronoi Tessellation
- Voronoi Tesselation - Paper.js
- Voronator - upload 3D model, download your voroni tesselated version
- Voronoi experiment @ karljones.com
- Fortune's algorithm for Voronoi diagrams
- Javascript implementation of Steven J. Fortune's algorithm to compute Voronoi diagrams
- Lloyd’s Relaxation - generates a centroidal Voronoi tessellation, which is where the seed point for each Voronoi region is also its centroid
- Voronoi diagram in JavaScript
- Spherical Voronoi Diagram
- Voronoi diagram code examples @ rosettacode.org

