Kiss Miami Goodbye: Difference between revisions
No edit summary |
No edit summary |
||
| Line 13: | Line 13: | ||
<gallery> | <gallery> | ||
File:Miami_Refugees.jpg|link=Miami Refugees|'''''[[Miami Refugees]]''''' is an American civil unrest reality television series starring police sociologists Sonny Crockett and Rico Tubbs, two former Metro-Dade Police Department detectives who now live in the Camps north of the New Miami Sea. | |||
File:Tallahassee_Seaside_Blues 2.jpg|link=Tallahassee Seaside Blues|"'''[[Tallahassee Seaside Blues]]'''" is a song about sea levels and property values. | |||
File:Titanic 2 - The Battle for Florida.jpg|link=Titanic 2: The Battle for Florida|'''''[[Titanic 2: The Battle for Florida]]''''' is a 2002 American political disaster film about he governor of sinking peninsula (Ron DeSantis) must build the world's mightiest ocean liner in order to save his family from climate change. | |||
</gallery> | </gallery> | ||
| Line 20: | Line 25: | ||
* [[Gnomon algorithm]] | * [[Gnomon algorithm]] | ||
* [[Gnomon Chronicles]] | * [[Gnomon Chronicles]] | ||
* ''[[Miami Refugees]]'' | |||
* [[Tallahassee Seaside Blues]] | |||
* ''[[Titanic 2: The Battle for Florida]]'' | |||
== Nonfiction cross-reference == | == Nonfiction cross-reference == | ||
Revision as of 05:14, 28 April 2023
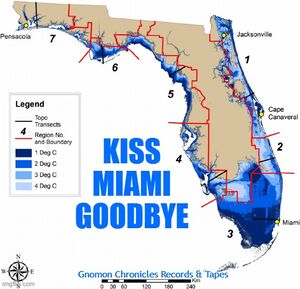
Kiss Miami Goodbye is a sea level rise noir crime film about several million people living in Federal refugee camps in the Central Florida highlands.
History
Context: "Florida may be underwater in 20 years?"
Just the coastal regions, not entire peninsula. And maybe more light fifty to eighty years.
Still, better kiss Miami goodbye, while we still have time.
In the News
Miami Refugees is an American civil unrest reality television series starring police sociologists Sonny Crockett and Rico Tubbs, two former Metro-Dade Police Department detectives who now live in the Camps north of the New Miami Sea.
"Tallahassee Seaside Blues" is a song about sea levels and property values.
Titanic 2: The Battle for Florida is a 2002 American political disaster film about he governor of sinking peninsula (Ron DeSantis) must build the world's mightiest ocean liner in order to save his family from climate change.
Fiction cross-reference
- Gnomon algorithm
- Gnomon Chronicles
- Miami Refugees
- Tallahassee Seaside Blues
- Titanic 2: The Battle for Florida
Nonfiction cross-reference
External links
- Florida sea level rise map - Florida base map showing extent of submergence associated with an atmospheric temperature increase of between 1 °C ( darkest blue ) and 4 °C (lightest blue). For each one degree rise in temperature, sea level was elevated 2.3 m (Levermann et al. 2013). Red lines depict boundaries of seven regions with common vulnerability to sea level rise as defined in this study. Black shore-perpendicular lines indicate location of representative topographic profiles shown in Fig. 2
Social media
- [ Post] @ Twitter (28 April 2023)


