Tephigram (nonfiction): Difference between revisions
Jump to navigation
Jump to search
| Line 14: | Line 14: | ||
== Nonfiction cross-reference == | == Nonfiction cross-reference == | ||
* [[Nomogram (nonfiction)]] - a two-dimensional diagram designed to allow the approximate graphical computation of a [[mathematical function (nonfiction)]]. | |||
External links: | External links: | ||
Revision as of 11:19, 21 August 2016
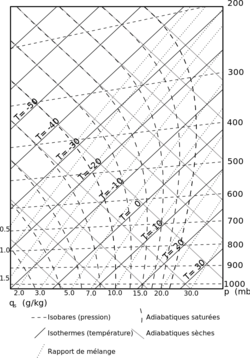
A tephigram is one of four thermodynamic diagrams commonly used in weather analysis and forecasting.
Description
The name evolved from the original name "T-Theta-gram" to describe the axes of temperature (T) and entropy used to create the plot.
Usually, temperature and dew point data from radiosondes are plotted on these diagrams to allow calculations of convective stability or convective available potential energy (CAPE).
Wind barbs are often plotted at the side of a tephigram to indicate the winds at different heights.
Fiction cross-reference
- Tephigram - one of four thermodynamic diagrams commonly used in computational weather engineering.
Nonfiction cross-reference
- Nomogram (nonfiction) - a two-dimensional diagram designed to allow the approximate graphical computation of a mathematical function (nonfiction).
External links:
- Tephigram @ Wikipedia
